8 WAYS TO MAKE FINANCIAL PRESENTATIONS MORE EFFECTIVE
Get the highlights in our quick whiteboard video.
A new challenge recently came my way, asking me to breathe life into a couple of financial presentations. This task reminded me of my days focusing on presentation design, a skill I’ve now also adapted to my latest passion: whiteboard animation.
Just as in those early days, the challenge remains the same – how do you make financial data, often seen as dry and uninteresting, capture and hold an audience’s attention?
From my experience, whether it’s a presentation or a whiteboard video, the principles of engaging your audience with data remain consistent. Here, I’ll share the insights I’ve gathered along the way.

1
Know your audience
2
Make it matter

3
Support decisions
Effective financial presentations do more than just share data. They empower your audience to make decisions that lead to action. For example, imagine you’re presenting CRM statistics to sales managers. Instead of simply listing numbers, the focus should be on how this data can directly help them achieve their sales targets.
The aim is to make the information actionable. For example, showing sales managers how lead conversion rates and selling prices correlate with sales outcomes can provide them with the insights they need to adjust their strategies effectively.
By presenting data in a way that highlights its direct impact on business goals, you help your audience make informed decisions that can drive their success forward. This approach not only enhances the value of your financial presentations but also reinforces your role as a key contributor to strategic planning.


Learn to explain complicated things in a simple way
Find out how to explain complicated things in a simple way that attracts and holds attention, builds trust, engages your audience, and moves them to act.
4
Use clear language

5
Stick to the essentials
6
Clear the clutter
In making your financial presentations shine, think of cutting the clutter not just in what you say, but how you show it.
Imagine each slide as a billboard—big, bold, and with just one key idea that grabs people’s attention.
You want your audience to get the point at a quick glance, not squint through a novel’s worth of details.
And when it comes to your charts, think minimalism.
Trim away the extra fluff that doesn’t help tell your story. A clean, straightforward chart speaks volumes more than one crammed with every piece of data you can find. By keeping things simple and focused, you make sure your key insights pop, making it easier for everyone to catch on and stay engaged.
It’s all about making your message hit home without the extra noise.

7
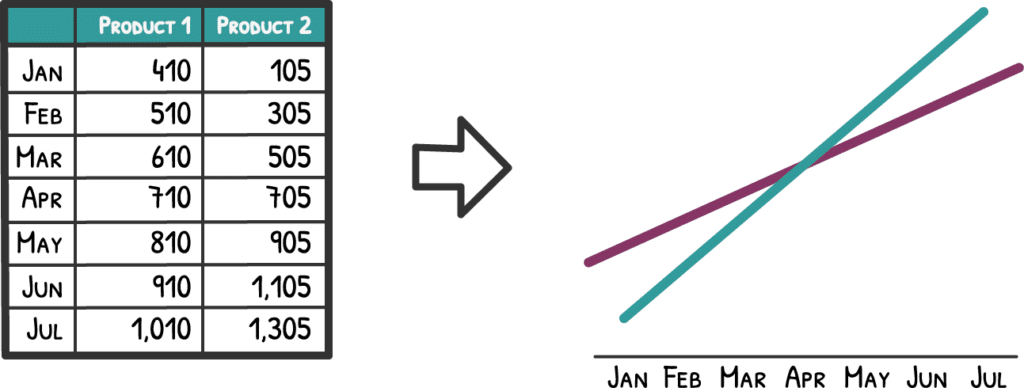
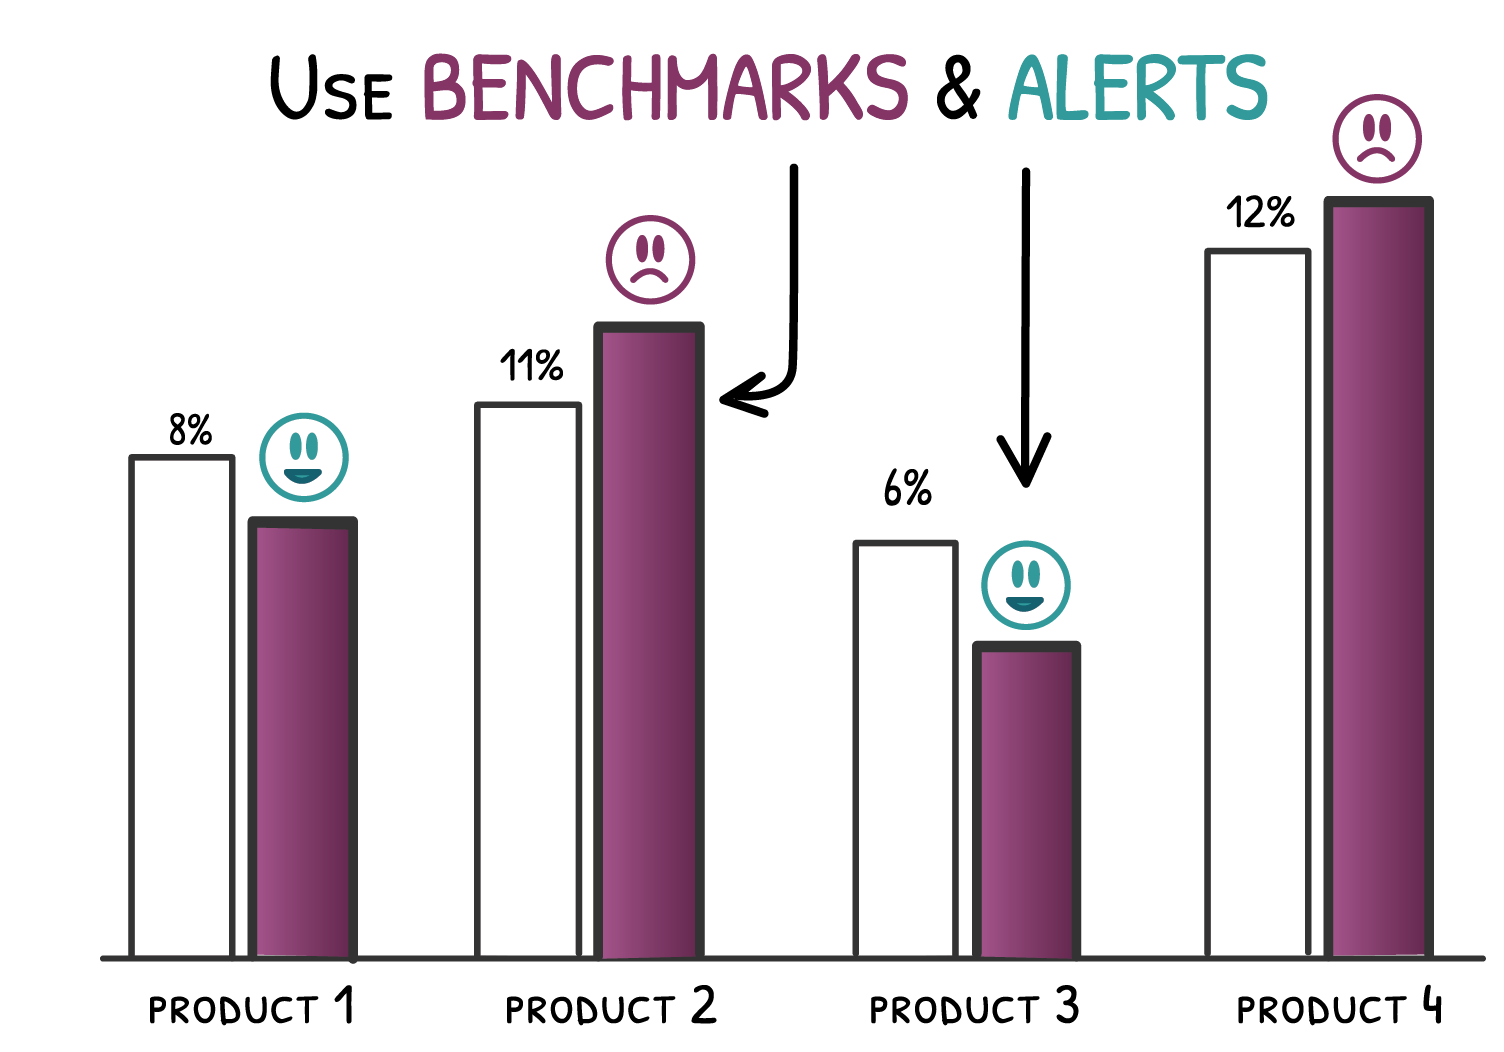
Make the data meaningful

8
End with key takeaways
Wrapping up your financial presentation on a strong note is crucial, and that’s where key takeaways come into play.
It’s not just about ending with a summary; it’s about leaving your audience with crystal-clear clarity and a sense of direction.
Highlight the main points one more time, but this time, frame them in a way that points to actionable steps. It’s like saying, “Here’s what we’ve learned, and here’s what we can do about it.
Nailing your financial presentations is key, no matter what business you’re in. We’ve laid out 8 essential tips to help you do just that. It’s all about making your audience sit up and listen, really get what you’re saying, and feel ready to take action. Whether it’s getting to know your audience inside out, making complex numbers easy to digest, or wrapping up with a bang, each tip is a stepping stone to turning dry data into a compelling visual story.
Think of it this way: With the right tricks up your sleeve, your financial presentations can do more than just share info; they can truly connect and convince. Ready to transform those numbers into narratives that not only inform but also inspire? Let’s dive in and make your next presentation a game-changer.
For more insights and guidance on mastering the art of effective communication, join our email list.


