6 Best Practices to Drive Quantifiable Results from Your Content Marketing Dashboard
Beautiful but useless.
So many web analytics dashboards are precisely that. A pretty look back at your past performance that leaves you bemused about what to do next.
For the past few weeks, I’ve been working to change that. At Exaltus, we produce monthly dashboards for clients who subscribe to our Blog in a Box content marketing plan. They’re for our clients but they’re also for us – to help us fine-tune our content marketing strategy and deliver results.
My goal, which I think I’ve achieved, was to put those dashboards on proverbial steroids. To build a dashboard that practically yells at us precisely which actions we need to take next for each of our clients.
In this post, I’ll share my six best practices for doing just that — my recipe for creating a content marketing dashboard that helps you attract more website visitors and turn them into new customers.
But first, let’s take a quick peek at what not to do.
"No matter what’s behind us in the rearview mirror, it’s always about what’s next."
– Dabo Swinney
Looking Backward Won’t Get the Job Done
I’ve been building Excel dashboards of one kind or another for more than a decade.
Some of them have been pretty cool. I’ve incorporated some fancy tricks – dynamic pull-downs that let you choose which metrics you want to see. Beautiful charts with adjustable scales depending on the data you chose to display.

But they never quite accomplished my ultimate goal: to provide real intelligence, to pinpoint which specific next actions I should take to achieve the results I wanted. Until now.
"Do the best you can until you know better. Then when you know better, do better."
– Maya Angelou
Six Best Practices to Make Your Content Marketing More Actionable
1
Measure your growth metrics
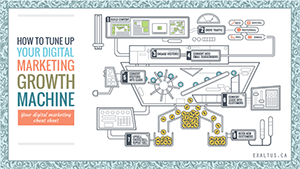
You’ve heard me talk about it: the growth machine. If you have a website, you have a growth machine. In my mind, it looks just like this:
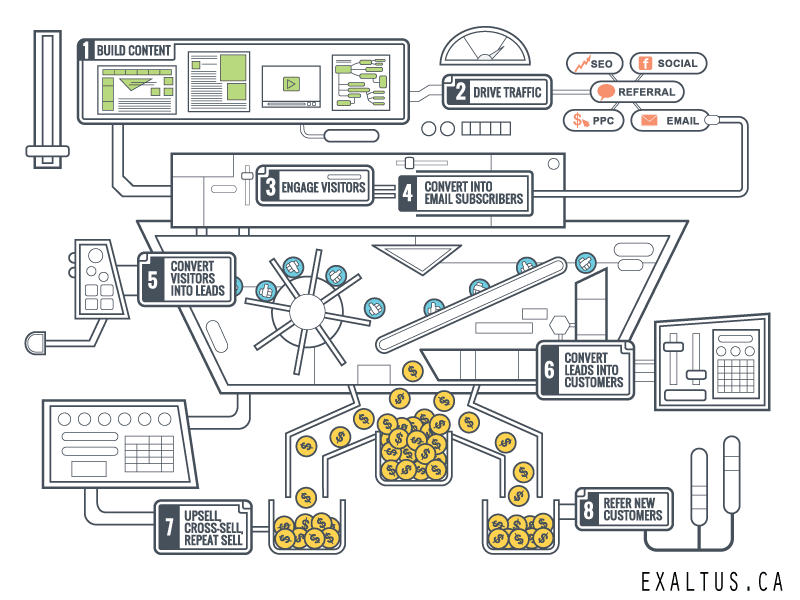
Here’s a simplified version of how your growth machine works:
- Consistently create high-quality content.
- Drive traffic to that content from multiple sources, including organic traffic, social media, other websites, and paid sources.
- Engage the visitors who come to your website, keeping them on your site, presenting more of your content, and enticing them to come back for more.
- Convert your visitors into email subscribers you can nurture, leads and customers.
- Delight your customers, entice them to purchase again, to purchase other products, and to refer you to others.
(For more detailed steps to follow, check out my post “Does Your Growth Machine Need a Tune-Up?”)
Each Lever Is an Opportunity
Each of these steps is a lever in your growth machine. One that you can calibrate. Optimize one of your levers, and you can grow your business. Optimize all of them, and you have a finely oiled growth machine that delivers real results.
That’s where your dashboard comes in. Your dashboard should help you measure and optimize each of the important levers of your business, including traffic by major source, engagement stats, and conversion stats.
Each of these steps is a lever in the machine that you can calibrate. Optimize one of them, and you can grow your business. Optimize all of them, and you have a finely oiled growth machine.
That’s where your dashboard comes in. Your dashboard should track each of those performance levers, including your different streams of traffic, engagement metrics, and your different types of conversions.
“We cannot do everything at once, but we can do something at once.”
– Calvin Coolidge
2
Highlight Exceptions
Let’s accept a reality: very few of us have endless hours to spend pouring over every number of a multi-page dashboard.
That’s why your content marketing dashboards have to let you:
- Quickly get a visual overall picture of your performance across your important business indicators.
- Provide context to make your data meaningful. (For example, 3,000 visits from Social sounds great, unless you know that social media drove 5,000 visits last month.)
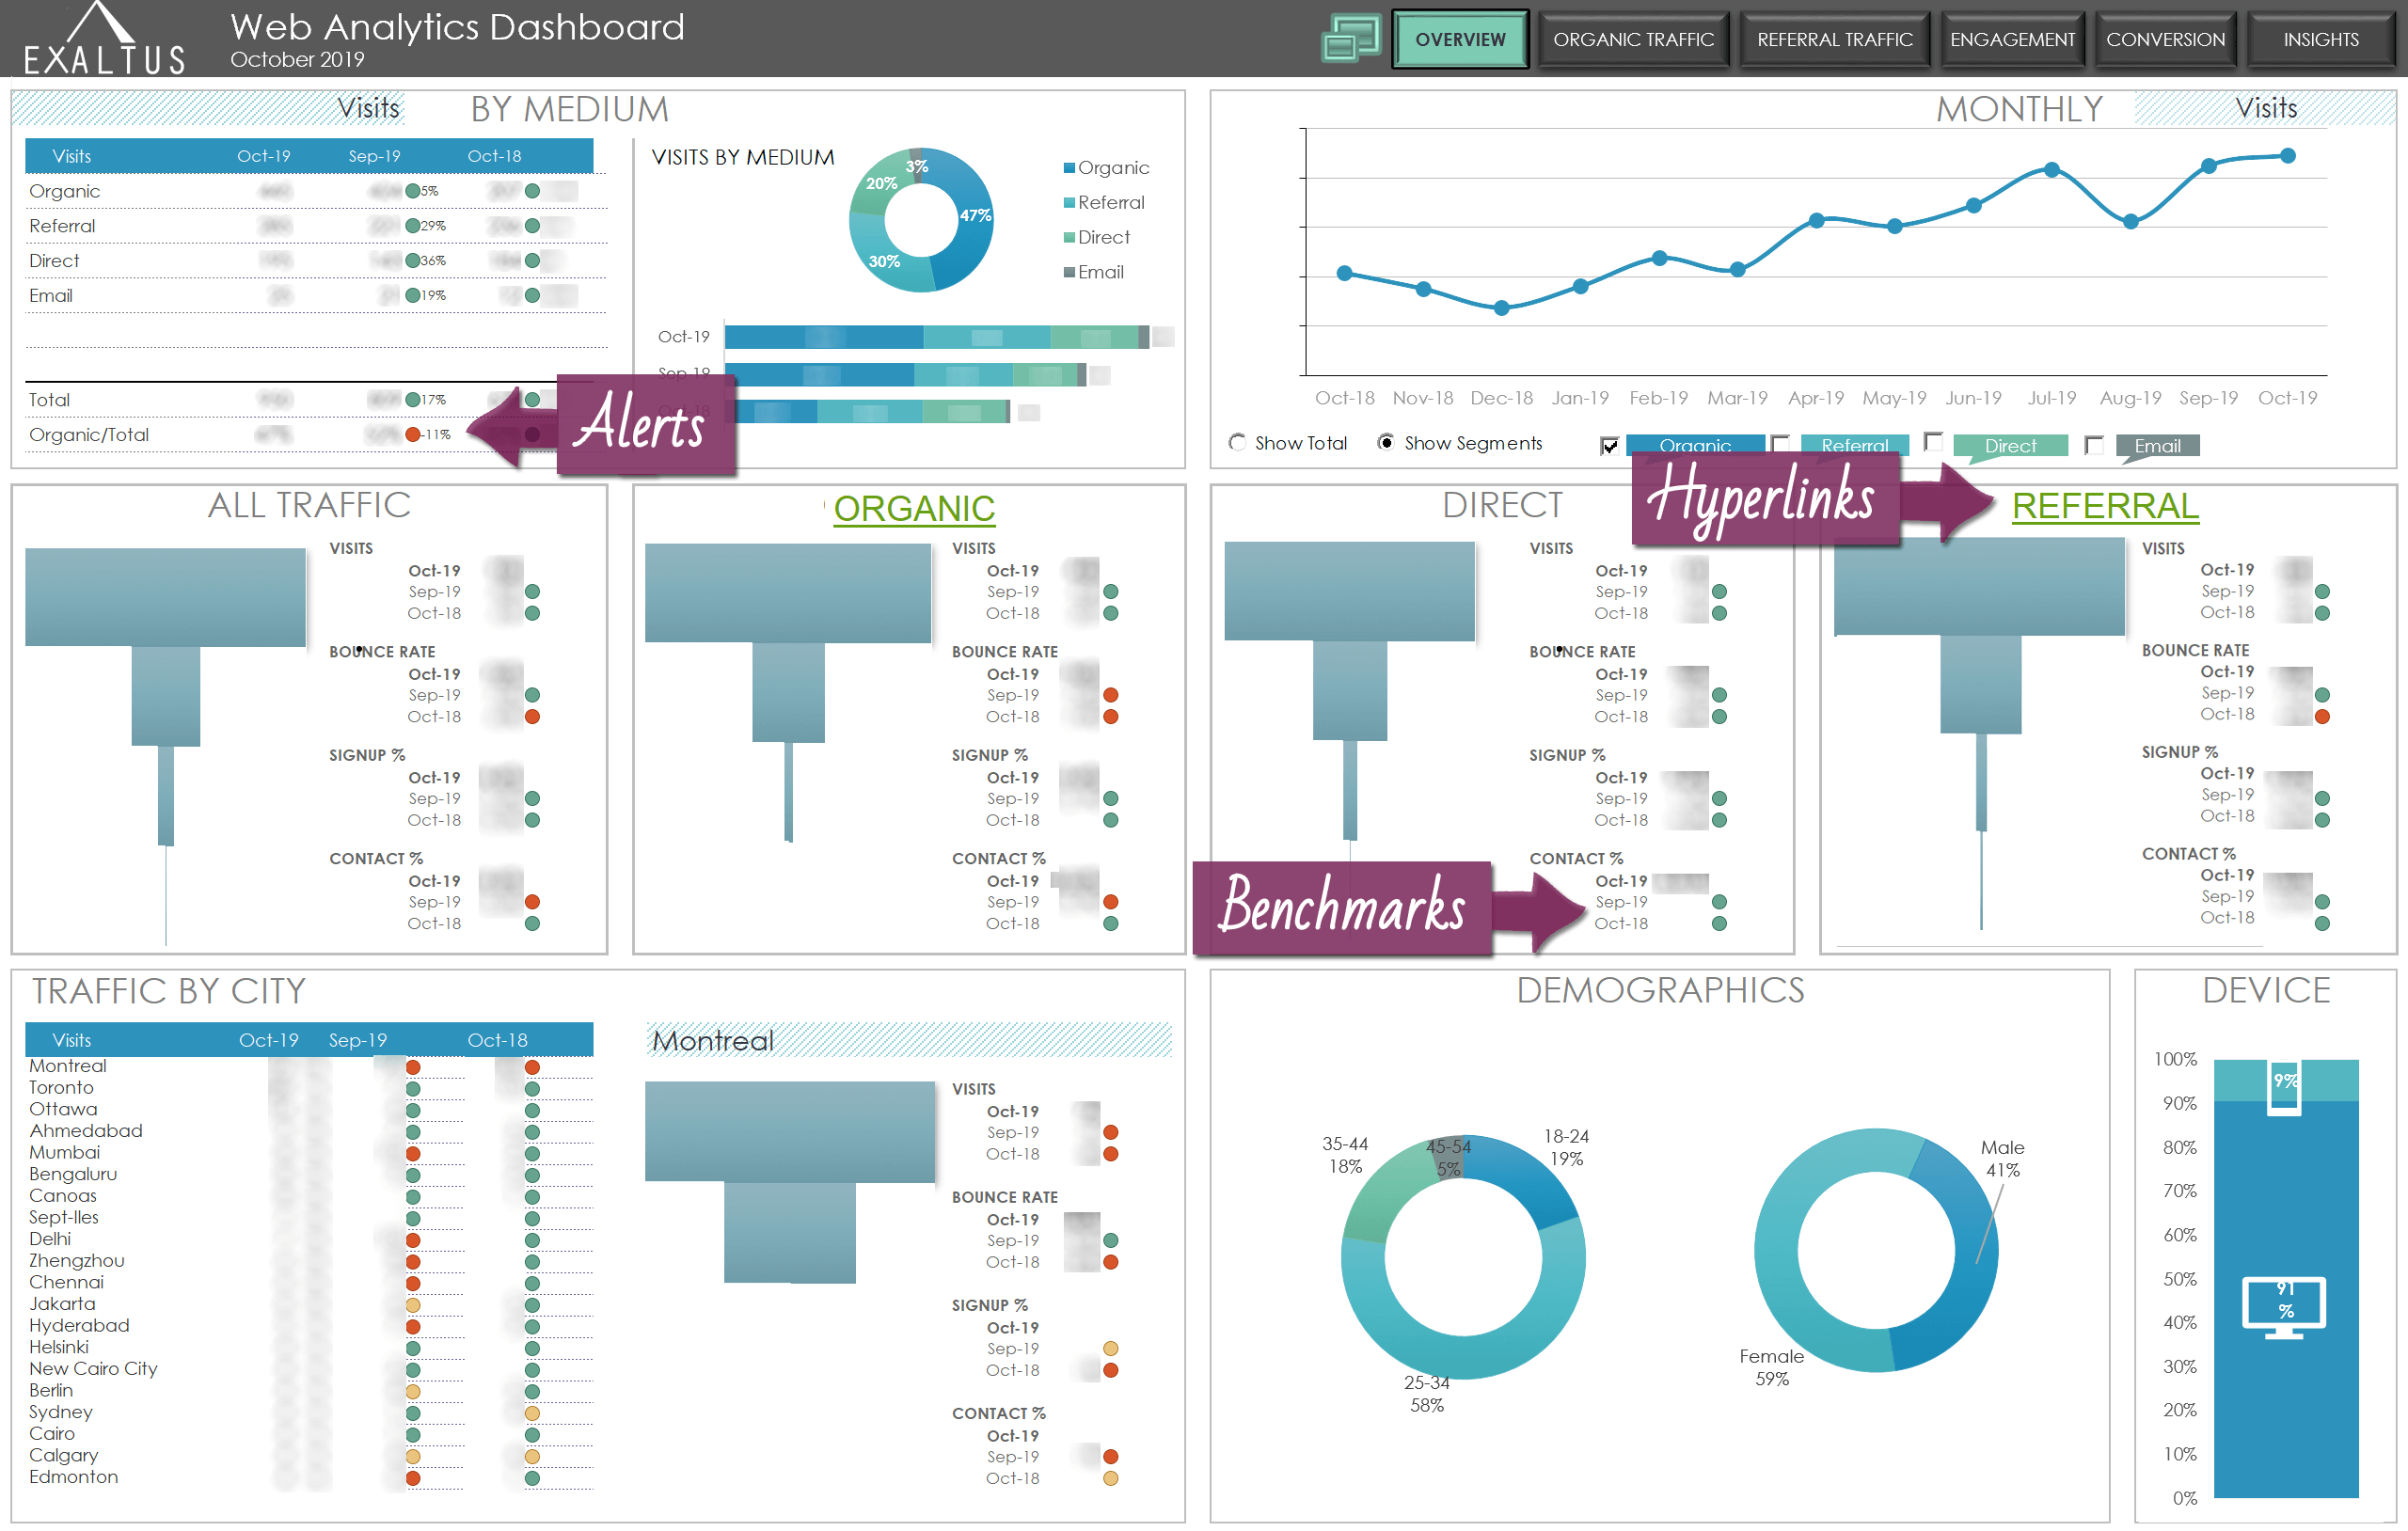
- Display alerts or use heat maps to flag problems and opportunities.
- Drill down on problem areas to get more information. (My dashboard has hyperlinks for that purpose.)
"What gets measured gets managed.”
– Peter Drucker
3
Include Activity Metrics
A key to making your dashboard actionable is to include some activity metrics.
Most dashboards include metrics that correspond to overall objectives. But if you want your content marketing dashboard to be actionable, you also need to keep track of how you’re doing against the tactics you use to reach those objectives.
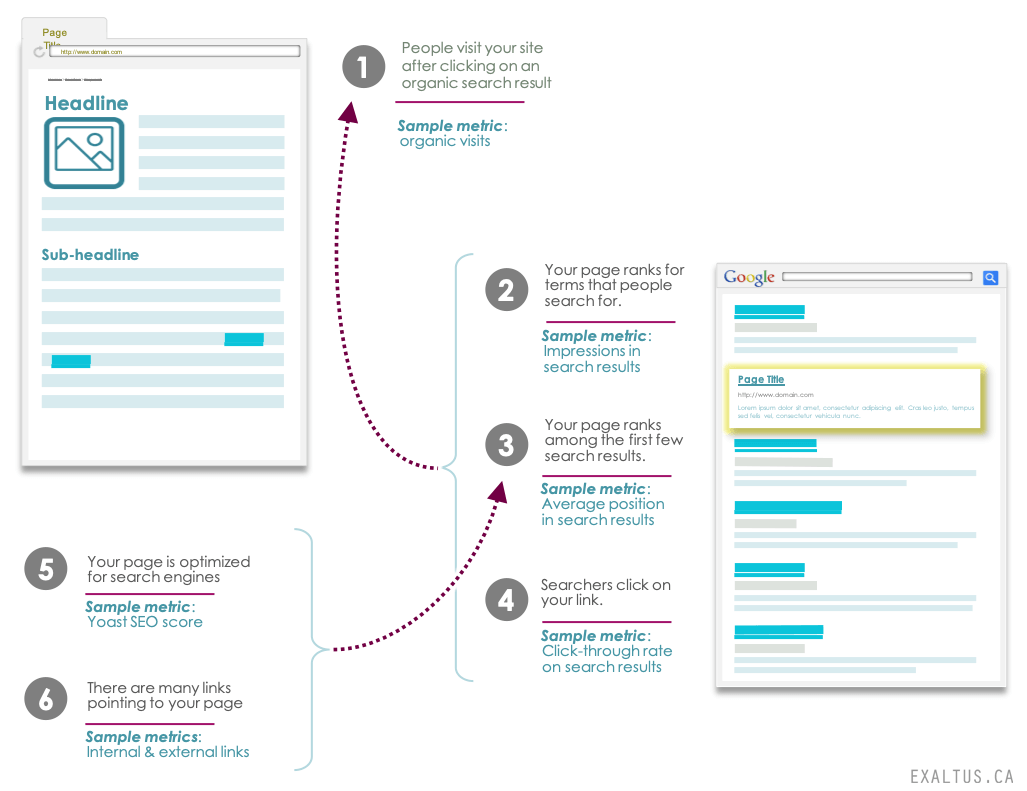
Let’s look at an example (summarized visually below). Let’s say you want to increase your organic traffic from google searches. (Who doesn’t?) You’ll want to
- Track at least one organic traffic metric like visits, visitors, new visitors, etc. Those are result metrics that show how you are performing against your end goal of boosting organic traffic.
Now let’s take a step back and look at what has to happen for you to maximize the level of organic traffic that comes to your site. As we do, we’ll highlight the corresponding metrics that your dashboard should track to measure your success.
What has to happen for a high number of searchers to visit your site from a search results page?
- Your page has to rank for terms that people are searching for. (Metric: search impressions, from Google Search Console)
- Your page has to rank among the first few search results. (Metric: average position, from Google Search Console)
- Searchers who see your results have to click on your link. (Metric: click-through rate, from Google Search Console)
And now let’s take another step back and focus on step 3, above:
What has to happen for your page to rank high in search results?
- Your page has to be well optimized for search engines. (Metric: SEO Score, from Yoast plugin)
- Your page has to receive a good number of incoming internal and external links. (Metrics: Internal and external links, from Google Search Console and SpyGlass)
So there are actually at least five metrics you should be tracking to optimize your organic traffic and make your dashboard actionable, in addition to your result metrics.
"Continuous improvement is better than delayed perfection."
– Mark Twain
4
Recommend Actions to Take
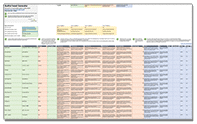
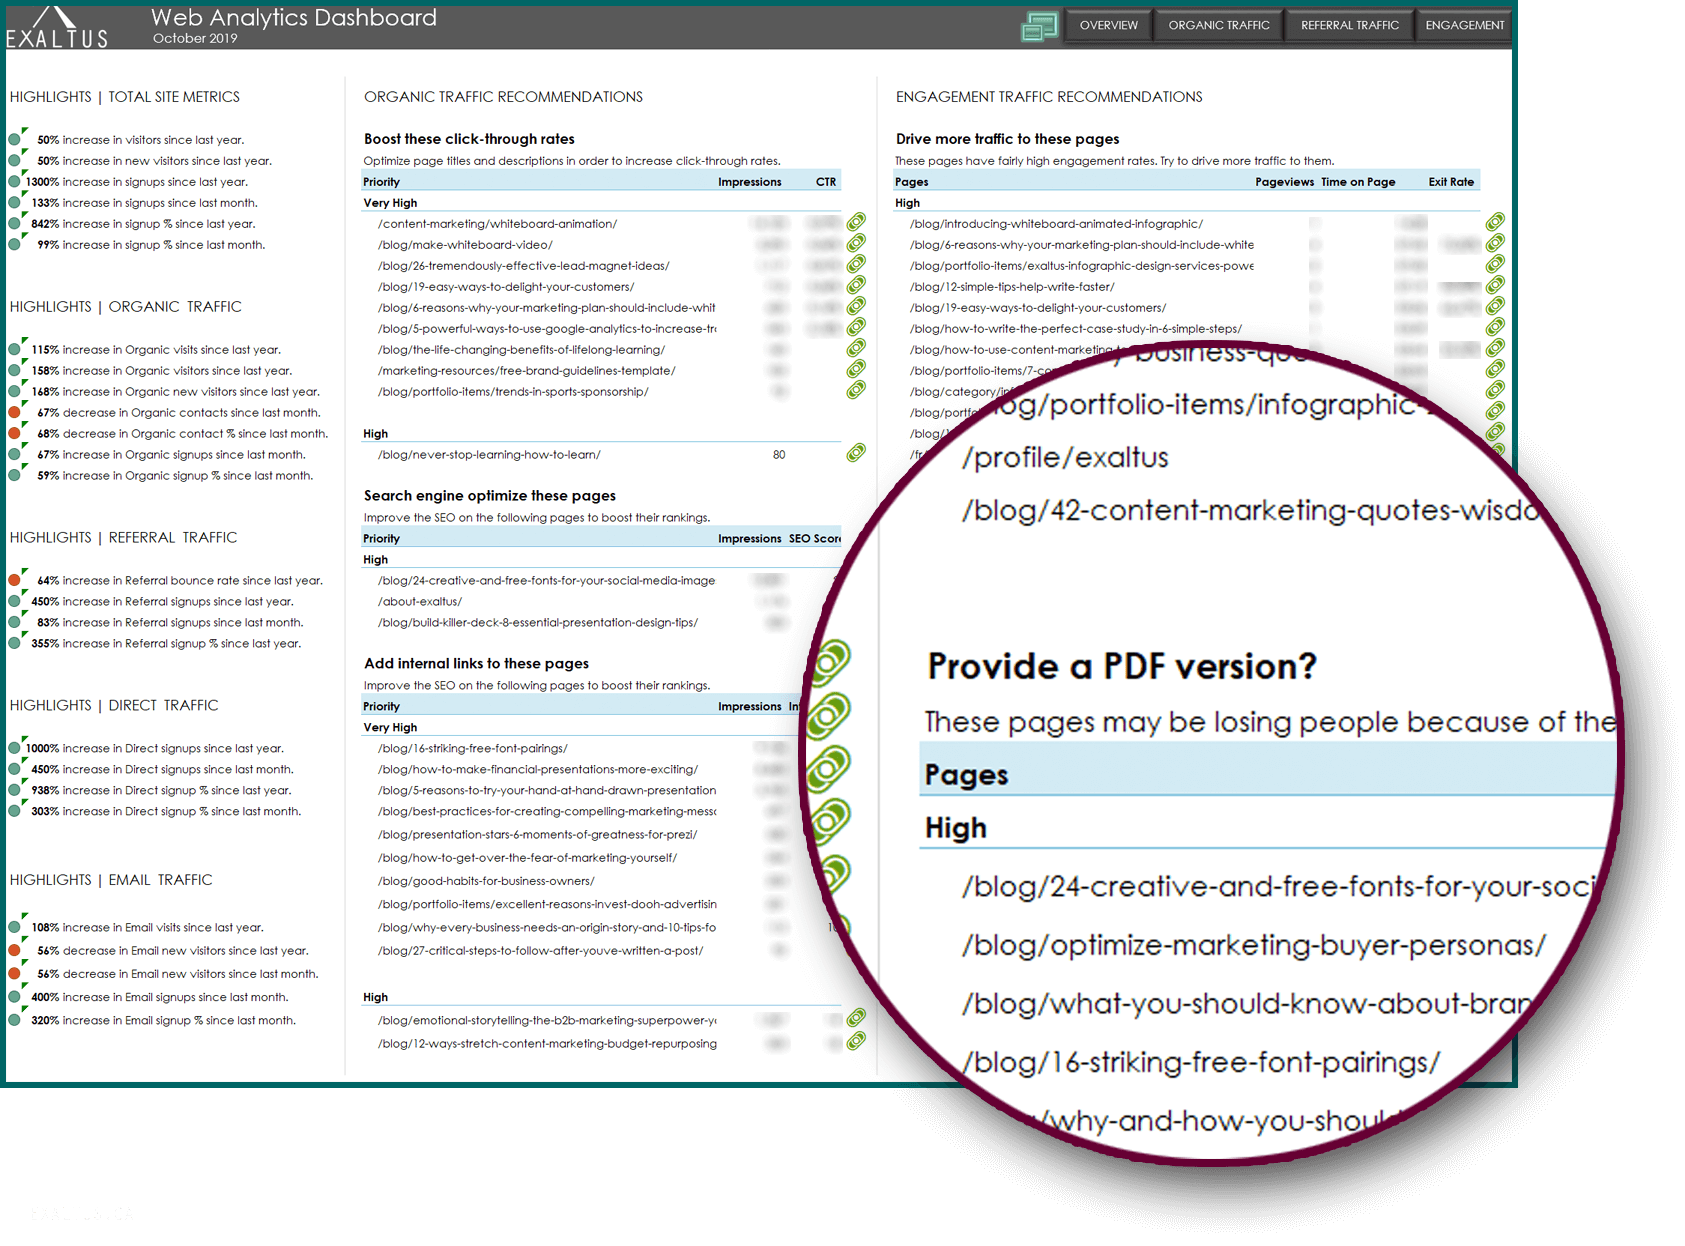
My new dashboard talks to me. It tells me what I need to do to move the needle in my business.
It does the heavy lifting in the background to analyze all my data and then spits out simple instructions for me. Here are just a few examples:
| Recommended Action | Analytical Basis |
|---|---|
| “Optimize the meta description of this page to increase its click-through rate” | (because the page ranks high on search engine results and receives a high number of search impressions…. BUT it has a low click-through rate. I.e. if I can just increase click-through rate, I’ll see a boost in traffic to the page.) |
| “Search engine optimize this page” or “Build links to this page” | (because there is a high volume of searches for pages like mine and many of those who find my result do click on it… BUT few people find the page because it ranks poorly. I.e. if I improve the page’s ranking I could see great results. The dashboard then analyzes the page’s SEO scores and incoming links to tell me which is the best way to boost the page’s rankings.) |
| “Add a downloadable PDF version of this blog post” | (because the people who stick around to read the page spend a lot of time on it, but many others bounce off the page because they just don’t have the time. I.e. if I provide a downloadable version of my post, I may gain subscribers!) |
| “Drive more traffic to this page” | (because the page has low traffic but people who do find it, love it: its engagement metrics and/or conversion rates are off the charts! I.e. if I can drive more traffic to this page I can win subscribers and customers.) |
| Etc. | Etc. |
In my dashboard, users get action recommendations in one of two ways:
- In each area of the dashboard, viewers can filter pages based on the action that needs to be taken.

- On a dedicated Insights page, the dashboard automatically recommends all the high-priority actions you should take for the month.
"Practice the philosophy of continuous improvement. Get a little bit better every single day."
– Author Unknown
5
Take Action!
All too often, marketers quickly glance at their monthly dashboard, crossing their fingers that they won’t see any drastic problems and praying for improvements they can proudly tout.
Minutes later, the dashboard is summarily put away and forgotten about until the following month.
A truly actionable dashboard is not used merely as a snapshot of your past performance. It’s your starting point!
When you get your news monthly dashboard, that’s when your work really begins.
Starting with the areas your dashboard has flagged for you, make improvements. Follow your action items. Eliminate those negative alerts. Get rid of the screaming red on your heat maps.
Your goal should be to get better results next month, at least in your activity metrics.
"You have to fall in love with the process of becoming great."
– Jeff Capel
6
Rinse & Repeat
This isn’t a one-off, it’s a process. Consistency is key. Remember that growth machine we talked about? Remember how we said that your content marketing dashboard is your tool to optimize it?
Well, fresh content is to your growth machine what logs are to fire. You need to keep adding fresh content to keep seeing results.
Every month, create new content, optimize it and promote it. (Having trouble keeping up with your content production? Read my post about batch creating content.)
And every month, use your dashboard to make the most of all the content you have: Optimize, optimize, and optimize your growth machine, and you will see results.
Over to You
Have you created a content marketing dashboard to monitor your progress and – more importantly – to drive improvements? Have you got some best practices that I didn’t mention? I’d love to hear from you.

